
Plumbing Risk Factors by City: A Data-Backed Comparison of Phoenix, San Antonio, Dallas, Austin, and San Diego
Why We Built This
Homeowners in different U.S. cities face genuinely different plumbing risk profiles — shaped by conditions they didn't choose and mostly can't change: how old their home's pipes are, how many days a year those pipes sit near or below freezing, how hot local summers get, how mineral-heavy the tap water is, and what kind of soil sits under the foundation. Much of the general advice online is broad ("hard water is bad for pipes") and does not always cite its sources. We wanted to see what the actual public data says, city by city, for the five metro areas PlumbRoute focuses on: Phoenix AZ, San Antonio TX, Dallas TX, Austin TX, and San Diego CA.
This comparison uses only Tier 1 government sources — U.S. Census Bureau data, NOAA/National Weather Service climate normals, USGS, EPA, municipal water-quality reports, and city/county government pages — supplemented by one industry source (the Insurance Information Institute) for national context, clearly labeled as such. Where our research couldn't verify a specific figure for a specific city, we say so directly rather than filling the gap with an assumed number. We also don't rank these cities against each other or declare any of them the "riskiest" — the underlying risk factors are different in kind (freeze vs. heat vs. mineral content vs. soil movement), and combining them into a single score would require a weighting methodology we don't have real evidence to defend.
One disclosure up front: PlumbRoute is a referral service. We help homeowners request a connection with independent local plumbing providers — we are not a plumbing contractor ourselves, we don't perform the work described here, and nothing in this piece is a service guarantee. The sources for the figures below are named in the table notes and in the Methodology & Sources section so they can be checked independently.
The Comparison
| Dimension | Phoenix, AZ | San Antonio, TX | Dallas, TX | Austin, TX | San Diego, CA |
|---|---|---|---|---|---|
| Housing built before 1990 | ~60% | ~60% | ~66% | ~47% (youngest) | ~71% (oldest) |
| Freeze days/year (≤32°F) | Not precisely logged | Not precisely logged | -2°F recorded, Feb 2021 | 33 days/yr avg | ~0 days/yr avg |
| Hot days per year (100°F+ unless noted) | Frequent (exact count not logged) | Frequent (exact count not logged) | Frequent (exact count not logged) | 123.5 days/yr ≥90°F | Mild coastal (not applicable) |
| Water hardness | 172-302 mg/L (10-17.6 gpg) | 15-20 gpg (about 257-342 mg/L) | 120-155 mg/L (about 7.0-9.1 gpg) | about 76-93 mg/L (about 4.4-5.4 gpg) | 216-284 ppm (very hard) |
| Distinctive soil/geology | Slab-on-grade standard | Expansive clay | Blackland Prairie clay | Clay (east) + limestone/karst (west) | Not yet logged |
| Homeownership rate | 57.3% | 52.2% | 42.4% | 43.4% | 47.3% |
| Median home value | $420,700 | $235,700 | $320,700 | $555,300 | $906,700 |
Housing age: U.S. Census Bureau ACS 2019-2023 5-Year Estimates, Table DP04. Climate: NOAA/NWS 1991-2020 climate normals. Water hardness: city/utility water quality reports (see sources below and our Southwest Water Hardness Index for each utility document and reporting period). Homeownership/home value: U.S. Census Bureau QuickFacts. Where a cell says "not logged," a source is cited in our evidence log but an exact figure wasn't confirmed -- we're disclosing that gap rather than estimating.
Why This Matters
Nationally, water damage and freezing are not a minor line item on a homeowner's insurance bill. According to the Insurance Information Institute, water damage and freezing accounted for 22.6% of all homeowners insurance losses in 2023, with an average paid claim of $15,400 and roughly 1 in 67 insured homes filing a water-damage or freezing claim in a given year. One important limit on this stat: it explicitly excludes Texas (along with Alaska and Puerto Rico) from its underlying data — so it can't be read as a Texas, San Antonio, Dallas, or Austin figure. We're including it purely as national context for why this category of risk is worth homeowners' attention at all, not as a claim about any specific city in this comparison.
Freeze Risk
Water expands roughly 9% in volume when it freezes. In a pipe that's fully or partially blocked by ice, that expansion can build enough pressure to damage pipes and fittings, including copper, PEX, and PVC — often discovered only after a thaw, when the crack starts leaking or the line bursts outright. Utilities and local governments commonly recommend insulating pipes that run through unheated spaces (attic, garage, exterior wall) and, during a hard freeze, letting an exposed faucet drip to keep water moving. Freeze exposure is highly uneven across these five cities: it's a recurring seasonal concern in the Texas markets (sharply amplified by the multi-day February 2021 statewide freeze event, and again during a January 2024 arctic blast) and much less common in Phoenix and San Diego, though occasional freezes can still occur.
Heat Risk
Extended runs of 90°F+ and 100°F+ days can accelerate wear on exposed outdoor fittings, hose bibs, and irrigation lines through repeated thermal expansion and contraction. We want to be direct about a sourcing limit here: we could not locate a dedicated federal explainer that quantifies heat's direct effect on residential plumbing the way freeze risk and water hardness are documented elsewhere in this piece. The heat-day figures cited above come straight from NOAA/NWS climate normals, not from a dedicated risk-modeling source — so this section is intentionally more conservative than the others.
Hard Water
Hard water carries a higher concentration of dissolved calcium and magnesium, picked up as groundwater or surface water moves through soil and rock on its way to the tap. Per the U.S. Geological Survey's Water Science School, when hard water is heated — as it constantly is inside a home water heater — it can leave behind solid calcium carbonate deposits, or "scale." Over time, scale buildup can narrow the interior diameter of pipes, reduce water pressure, and lower water-heater efficiency; USGS classifies water as soft (0-60 mg/L), moderately hard (61-120 mg/L), hard (121-180 mg/L), or very hard (over 180 mg/L). Of the five markets here, Phoenix, San Antonio, and San Diego report the highest mineral content in the table above, and Austin reports the lowest.
Soil & Geology
Expansive clay soils swell when they absorb water and shrink as they dry out — a repeating cycle that can place uneven pressure on both a home's foundation and the water and sewer lines running beneath or through a slab. The Colorado Geological Survey, describing the same general clay-soil hazard family found across parts of Texas, notes that annual expansive-soil losses are regularly estimated to exceed those from tornadoes, floods, earthquakes, and hurricanes combined nationwide, and specifically calls out "disruption of pipelines and sewer lines" as a documented consequence. Based on the soil and geologic mapping listed in the sources below, three of the five cities compared here sit on or near expansive clay formations (this is not a finding that the other two are free of soil-movement risk) — San Antonio, Dallas, and Austin (the latter also bordering Edwards Plateau limestone/karst geology, a different risk mechanism involving natural fractures and dissolution voids). Slab-on-grade construction is common in Phoenix. We don't yet have a soil or geology source logged for San Diego, and we're not going to guess at one.
Pipe Age
Older homes (the table uses a pre-1990 build date as a rough proxy) are more likely to still have original supply and drain lines and plumbing components at or past typical replacement age, and more likely to have been plumbed with materials — older galvanized steel or polybutylene, for instance — that fail more often than materials used in newer construction. The EPA's WaterSense program attributes household leaks broadly to "old piping, worn plumbing fixtures, corrosion, cold temperatures, irregular water pressure," and estimates the average home loses more than 9,300 gallons a year to leaks, with roughly 9% of homes losing 50 or more gallons a day to an unaddressed running leak. Housing age varies substantially across this five-city set — from San Diego's 71% built before 1990 down to Austin's 47%.
Methodology & Sources
All city-specific climate, housing, water-quality, soil, and permit data was compiled from Tier 1 government and utility sources per PlumbRoute's internal local data methodology. Where a source was cited but a specific figure wasn't confirmed, that gap is disclosed above rather than filled with an estimate. The one national-context stat (Insurance Information Institute) is industry rather than government data and is labeled accordingly, including its stated exclusion of Texas data.
- U.S. Census Bureau, QuickFacts and American Community Survey 2019-2023 5-Year Estimates (Table DP04) — census.gov, data.census.gov
- NOAA / National Weather Service, 1991-2020 Climate Normals and NCEI event reporting — weather.gov, ncei.noaa.gov
- San Antonio Water System, Austin Water, and Dallas Water Utilities water quality reports
- USDA NRCS soil survey data; USGS geologic and karst aquifer mapping
- City planning/development department permit pages for all 5 cities
- U.S. Department of Energy, Energy Saver / Building America program
- USGS Water Science School, "Hardness of Water"
- Colorado Geological Survey, "Expansive Soil and Rock"
- U.S. EPA WaterSense, "Fix a Leak Week"
- Insurance Information Institute, "Facts + Statistics: Homeowners and Renters Insurance" (national context only, excludes TX/AK/PR)
Sub-Freezing Hose Bib & Valve Fracture Diagnostic
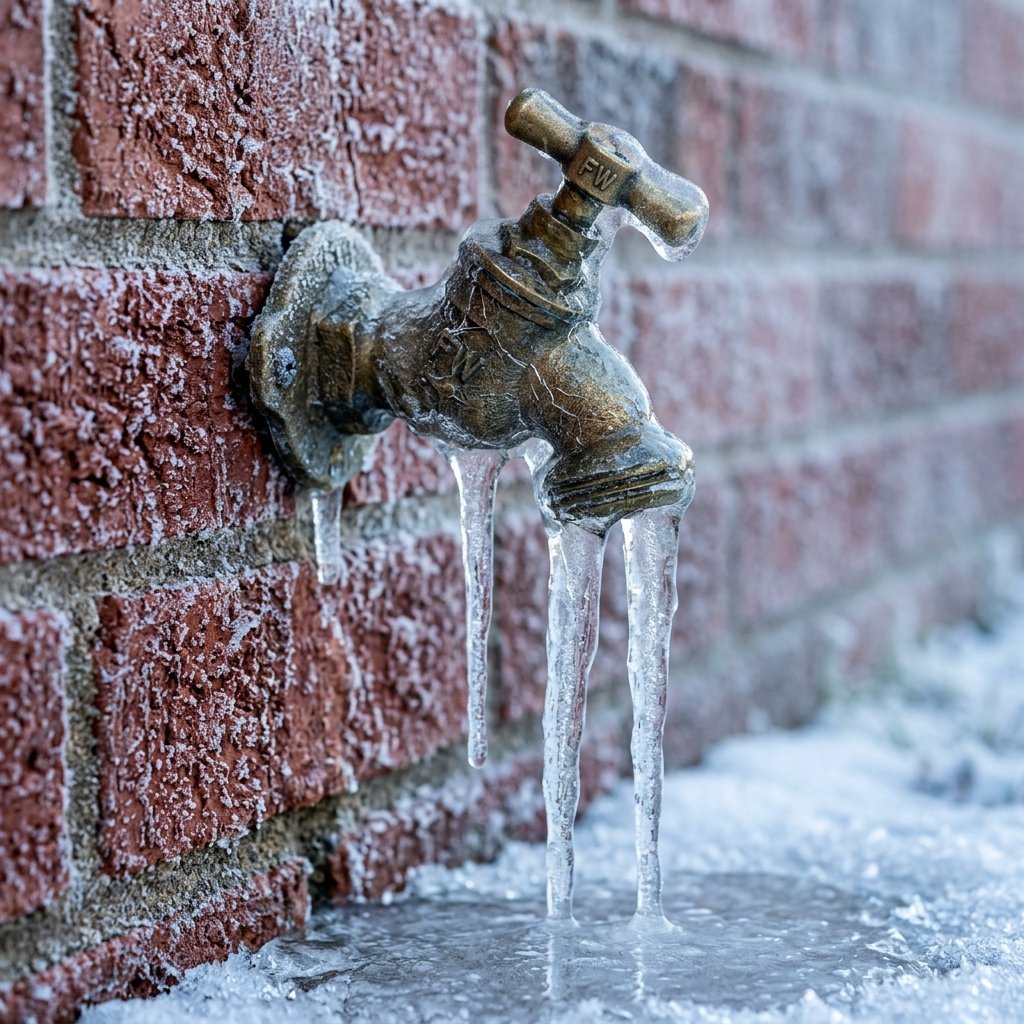
Macro failure analysis displaying crystalline ice expansion fracture through 3/4" heavy-duty brass ball valve body following sustained 18°F arctic front exposure.
Still dealing with this issue? You can request a connection with an independent local plumbing provider — there is no fee to submit a request.
Request a ConnectionFrequently asked questions
Looking for emergency plumbing in your area?
PlumbRoute is a referral service -- request a connection with an independent local plumber serving one of these areas:
24/7 Verified Dispatch · Phoenix AreaEmergency Plumbing Dispatch in Scottsdale, AZ
24/7 Verified Dispatch · Scottsdale AreaEmergency Plumbing Dispatch in Dallas, TX
24/7 Verified Dispatch · Dallas AreaEmergency Plumbing Dispatch in Fort Worth, TX
24/7 Verified Dispatch · Fort Worth AreaEmergency Plumbing Dispatch in Plano, TX
24/7 Verified Dispatch · Plano AreaEmergency Plumbing Dispatch in Frisco, TX
24/7 Verified Dispatch · Frisco AreaEmergency Plumbing Dispatch in Houston, TX
24/7 Verified Dispatch · Houston AreaEmergency Plumbing Dispatch in Austin, TX
24/7 Verified Dispatch · Austin AreaEmergency Plumbing Dispatch in San Antonio, TX
24/7 Verified Dispatch · San Antonio AreaEmergency Plumbing Dispatch in San Diego, CA
24/7 Verified Dispatch · San Diego Area
Need help with this?
Request a connection with an independent local plumbing provider.
PlumbRoute is a referral service, not a plumbing contractor.
Request an Estimate
Tell us about your project so a local provider can follow up with pricing.